Free Shipping On world wide
- HOME
- PRODUCTS
- IN THE NEWS
- SPECTRUM BLOG
- WEB SPECTRUM VIEWER
-
English
-
USD
Free Shipping On world wide


Soon we should be hearing about the timing and procedures for Auction 108: 2.5GHz Band. This auction is also been discussed as the EBS (Educational Broadcast Service) Whitespace auction since it is offering the unlicensed spectrum that was previously reserved for educational groups. In the maps below, we are going to use the data from our Mobile Carrier - Spectrum Ownership Analysis Tool to highlight the current status of both 2.5GHz sub-bands; Educational Broadcast Service (EBS) and Broadband Radio Service (BRS).
The first map indicates the counties where T-Mobile has up to 80MHz of 2.5GHz spectrum and the counties where it exceeds 80MHz of 2.5GHz spectrum. This cutoff highlights the markets where T-Mobile spectrum is limited to the BRS (owned) spectrum versus the markets where they have traditional leases to expand their spectrum resources into the EBS band.

The remaining maps are focused exclusively on the EBS spectrum band. This second map highlights the counties where more than 50% of the EBS spectrum (measured in MHz-POPs) is controlled by the FCC and available in Auction 108.


Today was the cutoff for comments on the EBS Whitespace Auction procedures, so let's take a look at the current status of the EBS Tribal applications, which have a priority on claiming EBS white space. From the chart below, 44% of the applications are still in process. Most concerning are the 83 applications that have been filed but have not seen any action by the FCC. Typically applications are moved to a pending status within a few weeks but these applications have been on file since 3Q - 2020.
| Tribal Applications | Status |
| Filed | 394 |
| Granted | 201 |
| Pending | 92 |
| Dismissed | 18 |
| No Action | 83 |
Below is a map of the granted tribal boundaries overlaid with the EBS A1 channel license areas. Each of these tribal applications has requested access to the first EBS auction channel (49.5MHz). Any tribal areas that extend into these license areas will not have access to the A1 channel (5.5MHz) in the overlap area.

Last year we provided an FCC Spectrum Screen Analysis reflecting the effects of the EBS reconfiguration, the CBRS allocation, and the C-band allocation. Two weeks ago the FCC has revised the Sub-6 GHz spectrum screen through their 3.45GHz rulemaking.
In the chart below we reflect the spectrum depth allotments that are included in our Mobile Carrier - Spectrum Ownership Analysis Tool. The links under in the frequency column will open the FCC spectrum screen documents and the comment field indicates the paragraphs where the spectrum screen is discussed.
The Allnet Spectrum Depth column indicates the spectrum allocations that we use in all of our typical spectrum depth reporting (county, CMA, PEA, State, and National). The FCC / Allnet Spectrum Screen allocations reflect the allocations that we use in our County, CMA market, and PEA Market Spectrum Screen columns.
| Band | Frequency | Allnet Spectrum Depth | FCC / Allnet Spectrum Screen | Comments |
| Low Band | 600 MHz | 70 | 70 | |
| Low Band | 700 MHz | 90 | 70 | First Net Spectrum not included |
| Low Band | Cellular | 50 | 50 | |
| Low Band | SMR | 14 | 14 | |
| Lw Mid Band | PCS | 140 | 140 | Includes H-block |
| Lw Mid Band | AWS-1 | 90 | 90 | |
| Lw Mid Band | AWS-3 | 65 | 65 | |
| Lw Mid Band | AWS-4 | 40 | 40 | |
| Up Mid Band | WCS | 30 | 20 | |
| Up Mid Band | BRS | 77.5 | 67.5 | BRS1 and BRS K guard bands not included |
| Up Mid Band | EBS | 116.5 | 116.5 | Paragraph 98-100 |
| Up Mid Band | 3.45GHz | 100 | 100 | Paragraph 101 |
| Up Mid Band | CBRS | 0 | 0 | Paragraph 107 |
| Up Mid Band | C-Band | 280 | 280 | Paragraph 83 |
| Total MHz | 1163 | 1123 |
To determine the overall Spectrum Screen value, the FCC divides the spectrum screen allotment (1123) by 3 and rounds to the nearest 10MHz. This makes the new spectrum screen including the 100MHz of 3.45GHz spectrum, 370 MHz.
In the Mobile Carrier - Spectrum Ownership Analysis Tool we have three views into the Spectrum Screen. They are a County Analysis View, a Cellular Market Area (CMA) View, and a Partial Economic Area (PEA) View.
County Analysis View:
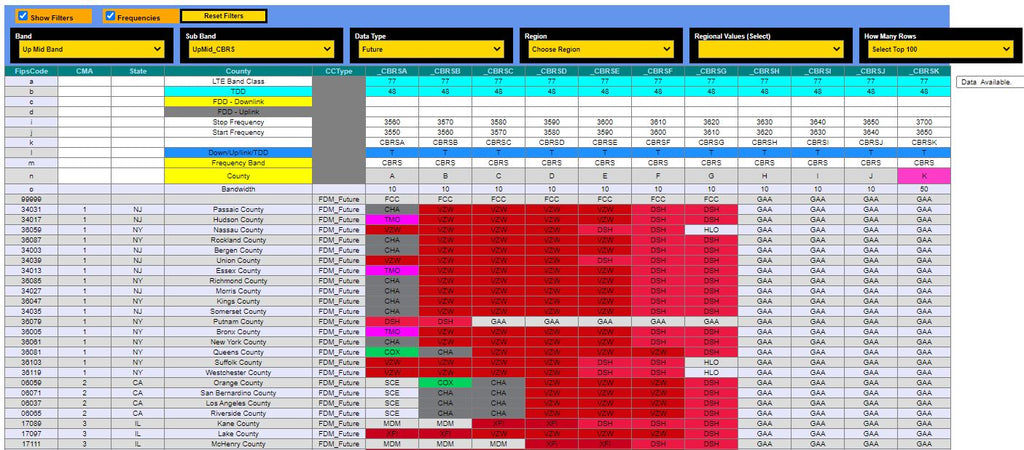
In this view, each of the national carriers spectrum screen values are displayed along with the amount of spectrum in that county controlled by the FCC. The FCC value predominately represents the 3.45GHz spectrum allocation, but there is some EBS spectrum (whitespace) that is also allocated to the FCC.

PEA Market Analysis View:

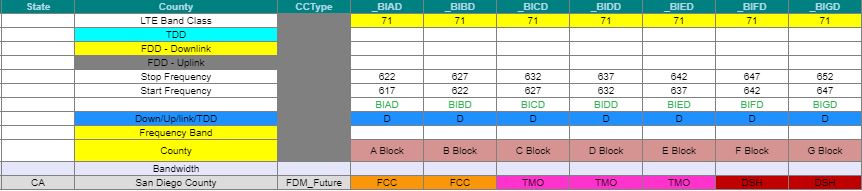
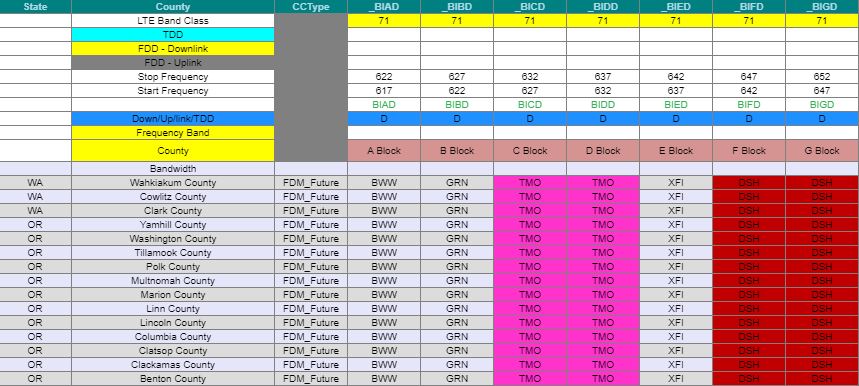
The FCC announced the final rules for the new 3.45GHz band on March 19, 2021. With our April 2021 release, we updated our Mobile Carrier - Spectrum Ownership Analysis Tool to include the 3.45GHz frequency band in each of the analysis modules. The 10 - 10MHz channels appear in our Spectrum Grid as a part of NR Band 77. In the image below, we highlight the FCC's ownership of each of the channels (pre-auction) by county.

Honolulu County has a NA (Not Available) code for both the 3.45GHz spectrum and the C-band spectrum since neither band in available in Hawaii, Alaska, Puerto Rico, American Samoa, Northern Mariana Islands, Virgin Islands, and Puerto Rico. Looking at the National Band Ownership Charts, we can see that this unavailability affects 2% of the MHz-POPs or 2% of the US Population (~6.6M).

In the County Analysis Module the spectrum depth values for eight selected carriers are displayed. This image highlights each carriers 3.45GHz, CBRS, and C-band holdings.

Below is a more detailed description of our Spectrum Ownership Analysis Tools and the analysis capabilities it supports.

On March 15th, the FCC granted the first CBRS PAL licenses to 222 carriers. In total the FCC issued nearly 17,500 PAL licenses in this initial group. To view these licenses in our Web Spectrum Viewer, choose our Upper Mid-band (Up-Mid Band) in the band menu and chose the CBRS in the sub-band menu.
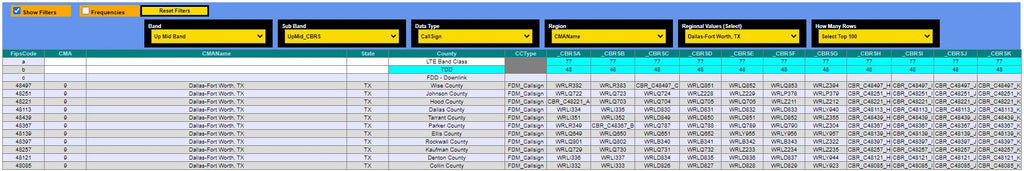
To find PAL licenses for specific markets, use our geographic filters. To find call signs for the Dallas/Fort Worth market, chose CMA Name in the Region menu and start typing Dallas in the Regional Values menu.

In this view you can see the PAL licenses that each carrier controls for each county in the Dallas/Fort Worth CMA market. From this view there are two ways to view the call sign for each license. The first way is to click on the spectrum grid cell to reveal the call sign details for that cell. The detail below is for the CBRS-A channel that Charter controls in Dallas county.

| Attachment A | |||||||||||
| Auction 108 License Inventory Subject to the Results of the Rural Tribal Priority Window | |||||||||||
| Proposed Bidding Units, Upfront Payments, and Minimum Bids | |||||||||||
| State/ Territory |
County Name | FIPS Code |
Channel | Item ID | Band- width |
MEA | Population (2010) |
Subject to Small Market Cap | Bidding Units |
Upfront Payment |
Minimum Bid |
| AL | Autauga | 1001 | 1 | AL-001-1 | 49.5 | 24 | 54,571 | Yes | 80 | $8,000 | $10,000 |
| AL | Autauga | 1001 | 2 | AL-001-2 | 50.5 | 24 | 54,571 | Yes | 80 | $8,000 | $10,000 |
| AL | Autauga | 1001 | 3 | AL-001-3 | 16.5 | 24 | 54,571 | Yes | 20 | $2,000 | $5,000 |
| AL | Baldwin | 1003 | 1 | AL-003-1 | 49.5 | 27 | 182,265 | No | 200 | $20,000 | $50,000 |
| AL | Baldwin | 1003 | 2 | AL-003-2 | 50.5 | 27 | 182,265 | No | 200 | $20,000 | $50,000 |
| AL | Baldwin | 1003 | 3 | AL-003-3 | 16.5 | 27 | 182,265 | No | 90 | $9,000 | $10,000 |
| AL | Barbour | 1005 | 1 | AL-005-1 | 49.5 | 24 | 27,457 | Yes | 40 | $4,000 | $8,000 |
| AL | Barbour | 1005 | 2 | AL-005-2 | 50.5 | 24 | 27,457 | Yes | 40 | $4,000 | $8,000 |
| AL | Barbour | 1005 | 3 | AL-005-3 | 16.5 | 24 | 27,457 | Yes | 10 | $1,000 | $2,000 |
| AL | Bibb | 1007 | 1 | AL-007-1 | 49.5 | 24 | 22,915 | Yes | 30 | $3,000 | $6,000 |
| AL | Bibb | 1007 | 2 | AL-007-2 | 50.5 | 24 | 22,915 | Yes | 30 | $3,000 | $6,000 |
| AL | Bibb | 1007 | 3 | AL-007-3 | 16.5 | 24 | 22,915 | Yes | 10 | $1,000 | $2,000 |
| AL | Blount | 1009 | 1 | AL-009-1 | 49.5 | 24 | 57,322 | Yes | 80 | $8,000 | $10,000 |
| AL | Blount | 1009 | 2 | AL-009-2 | 50.5 | 24 | 57,322 | Yes | 80 | $8,000 | $10,000 |
| AL | Blount | 1009 | 3 | AL-009-3 | 16.5 | 24 | 57,322 | Yes | 20 | $2,000 | $5,000 |
| AL | Bullock | 1011 | 1 | AL-011-1 | 49.5 | 24 | 10,914 | Yes | 10 | $1,000 | $3,000 |
| AL | Bullock | 1011 | 2 | AL-011-2 | 50.5 | 24 | 10,914 | Yes | 10 | $1,000 | $3,000 |
| AL | Bullock | 1011 | 3 | AL-011-3 | 16.5 | 24 | 10,914 | Yes | 5 | $500 | $1,000 |
| AL | Butler | 1013 | 1 | AL-013-1 | 49.5 | 24 | 20,947 | Yes | 30 | $3,000 | $6,000 |
| AL | Butler | 1013 | 2 | AL-013-2 | 50.5 | 24 | 20,947 | Yes | 30 | $3,000 | $6,000 |
| AL | Butler | 1013 | 3 | AL-013-3 | 16.5 | 24 | 20,947 | Yes | 10 | $1,000 | $2,000 |
| AL | Chambers | 1017 | 2 | AL-017-2 | 50.5 | 8 | 34,215 | Yes | 50 | $5,000 | $10,000 |
| AL | Cherokee | 1019 | 1 | AL-019-1 | 49.5 | 8 | 25,989 | Yes | 30 | $3,000 | $7,000 |
| AL | Cherokee | 1019 | 2 | AL-019-2 | 50.5 | 8 | 25,989 | Yes | 30 | $3,000 | $7,000 |
| AL | Cherokee | 1019 | 3 | AL-019-3 | 16.5 | 8 | 25,989 | Yes | 10 | $1,000 | $2,000 |
| AL | Chilton | 1021 | 1 | AL-021-1 | 49.5 | 24 | 43,643 | Yes | 60 | $6,000 | $10,000 |
| AL | Chilton | 1021 | 2 | AL-021-2 | 50.5 | 24 | 43,643 | Yes | 60 | $6,000 | $10,000 |
| AL | Chilton | 1021 | 3 | AL-021-3 | 16.5 | 24 | 43,643 | Yes | 20 | $2,000 | $4,000 |
| AL | Choctaw | 1023 | 1 | AL-023-1 | 49.5 | 26 | 13,859 | Yes | 20 | $2,000 | $4,000 |
| AL | Choctaw | 1023 | 2 | AL-023-2 | 50.5 | 26 | 13,859 | Yes | 20 | $2,000 | $4,000 |
| AL | Choctaw | 1023 | 3 | AL-023-3 | 16.5 | 26 | 13,859 | Yes | 6 | $600 | $1,000 |
| AL | Clarke | 1025 | 1 | AL-025-1 | 49.5 | 27 | 25,833 | No | 30 | $3,000 | $7,000 |
| AL | Clarke | 1025 | 2 | AL-025-2 | 50.5 | 27 | 25,833 | No | 30 | $3,000 | $7,000 |
| AL | Clarke | 1025 | 3 | AL-025-3 | 16.5 | 27 | 25,833 | No | 10 | $1,000 | $2,000 |
| AL | Clay | 1027 | 1 | AL-027-1 | 49.5 | 8 | 13,932 | Yes | 20 | $2,000 | $4,000 |
| AL | Clay | 1027 | 2 | AL-027-2 | 50.5 | 8 | 13,932 | Yes | 20 | $2,000 | $4,000 |
| AL | Clay | 1027 | 3 | AL-027-3 | 16.5 | 8 | 13,932 | Yes | 6 | $600 | $1,000 |
| AL | Cleburne | 1029 | 2 | AL-029-2 | 50.5 | 8 | 14,972 | Yes | 20 | $2,000 | $4,000 |
| AL | Coffee | 1031 | 1 | AL-031-1 | 49.5 | 24 | 49,948 | Yes | 70 | $7,000 | $10,000 |
| AL | Coffee | 1031 | 2 | AL-031-2 | 50.5 | 24 | 49,948 | Yes | 70 | $7,000 | $10,000 |
| AL | Coffee | 1031 | 3 | AL-031-3 | 16.5 | 24 | 49,948 | Yes | 20 | $2,000 | $4,000 |
| AL | Conecuh | 1035 | 1 | AL-035-1 | 49.5 | 27 | 13,228 | No | 10 | $1,000 | $3,000 |
| AL | Conecuh | 1035 | 2 | AL-035-2 | 50.5 | 27 | 13,228 | No | 10 | $1,000 | $3,000 |
| AL | Conecuh | 1035 | 3 | AL-035-3 | 16.5 | 27 | 13,228 | No | 6 | $600 | $1,000 |
| AL | Coosa | 1037 | 1 | AL-037-1 | 49.5 | 8 | 11,539 | Yes | 10 | $1,000 | $3,000 |
| AL | Coosa | 1037 | 2 | AL-037-2 | 50.5 | 8 | 11,539 | Yes | 10 | $1,000 | $3,000 |
| AL | Coosa | 1037 | 3 | AL-037-3 | 16.5 | 8 | 11,539 | Yes | 5 | $500 | $1,000 |
| AL | Covington | 1039 | 1 | AL-039-1 | 49.5 | 24 | 37,765 | Yes | 50 | $5,000 | $10,000 |
| AL | Covington | 1039 | 2 | AL-039-2 | 50.5 | 24 | 37,765 | Yes | 50 | $5,000 | $10,000 |
| AL | Covington | 1039 | 3 | AL-039-3 | 16.5 | 24 | 37,765 | Yes | 10 | $1,000 | $3,000 |
| AL | Crenshaw | 1041 | 1 | AL-041-1 | 49.5 | 24 | 13,906 | Yes | 20 | $2,000 | $4,000 |
| AL | Crenshaw | 1041 | 2 | AL-041-2 | 50.5 | 24 | 13,906 | Yes | 20 | $2,000 | $4,000 |
| AL | Crenshaw | 1041 | 3 | AL-041-3 | 16.5 | 24 | 13,906 | Yes | 6 | $600 | $1,000 |
| AL | Cullman | 1043 | 1 | AL-043-1 | 49.5 | 24 | 80,406 | Yes | 100 | $10,000 | $20,000 |
| AL | Cullman | 1043 | 2 | AL-043-2 | 50.5 | 24 | 80,406 | Yes | 100 | $10,000 | $20,000 |
| AL | Cullman | 1043 | 3 | AL-043-3 | 16.5 | 24 | 80,406 | Yes | 30 | $3,000 | $7,000 |
| AL | Dale | 1045 | 1 | AL-045-1 | 49.5 | 24 | 50,251 | Yes | 70 | $7,000 | $10,000 |
| AL | Dale | 1045 | 2 | AL-045-2 | 50.5 | 24 | 50,251 | Yes | 70 | $7,000 | $10,000 |
| AL | Dale | 1045 | 3 | AL-045-3 | 16.5 | 24 | 50,251 | Yes | 20 | $2,000 | $4,000 |
| AL | Dallas | 1047 | 1 | AL-047-1 | 49.5 | 24 | 43,820 | Yes | 60 | $6,000 | $10,000 |
| AL | Dallas | 1047 | 2 | AL-047-2 | 50.5 | 24 | 43,820 | Yes | 60 | $6,000 | $10,000 |
| AL | Dallas | 1047 | 3 | AL-047-3 | 16.5 | 24 | 43,820 | Yes | 20 | $2,000 | $4,000 |


Educational Broadband Service (EBS) is part of the US 2.5GHz spectrum allocation along with the Broadband Radio Service (BRS). These two types of spectrum fall between 2495MHz and 2690MHz on the 2.5GHz band allocation.

EBS spectrum has traditionally been owned by educators, including colleges, universities, K-12 school districts, and para-church organizations. Originally, the EBS and BRS spectrum licensees were assigned 35-mile licensing circles around a set of coordinates representing the original broadcasting site. In 2009, the Federal Communications Commission (FCC) held an auction for the areas of unlicensed BRS spectrum (all BRS spectrum outside of the licensed circles). However, unlicensed EBS spectrum has never been made available to the public, and thus remains under FCC control. This unlicensed spectrum is precisely what will be auctioned off in early 2021.
Given that the EBS Whitespace Auction is focused on the unlicensed area surrounding existing licenses, a basic understanding of how current EBS license areas are structured is necessary to evaluate the available whitespace areas.
Existing EBS licenses are organized into what are referred to as geographic service areas — or GSAs. According to the FCC’s licensing description for BRS and EBS spectrum, “the GSA of a P35 license (which can be either BRS or EBS) generally consists of the station’s 35-mile radius around the protected service area coordinates. In those instances where two co-channel stations have overlapping protected GSAs, the GSA of each license may be reduced due to the ‘splitting the football’ approach used to divide the overlap area between the licensees.” The FCC’s Universal Licensing System (ULS) database does not reflect changes made to the GSAs based on overlapping service areas.
In developing our EBS Whitespace Auction Opportunities Tool, we have generated geographic license areas for every existing license across all EBS and BRS channels. While there are other companies that may make available their interpretation of each licensee’s GSA, our license areas take into account many of the nuanced licensing details that are easy to overlook. Our licensing expertise ties back to our president’s time spent at Clearwire as their Director of Spectrum Operations, where he developed a profound understanding of EBS/BRS licensing. This experience has contributed to what we believe is the most accurate representation for all of the EBS/BRS license areas. No one has attempted to analyze each county’s whitespace based upon these license areas, making the resulting data, available in our EBS Whitespace Auction Opportunities Tool, a crucial part of your Whitespace Auction strategy which is not available from any other source.
Our license areas account for:

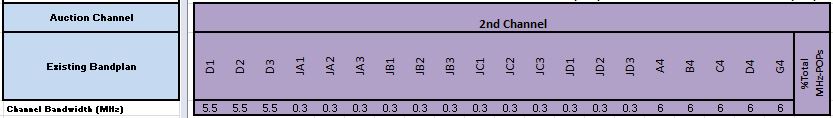
For the EBS Whitespace Auction, the FCC created individual auction channels from the EBS channels illustrated previously. The original sub-channels have been allocated to form the three distinct auction channels.
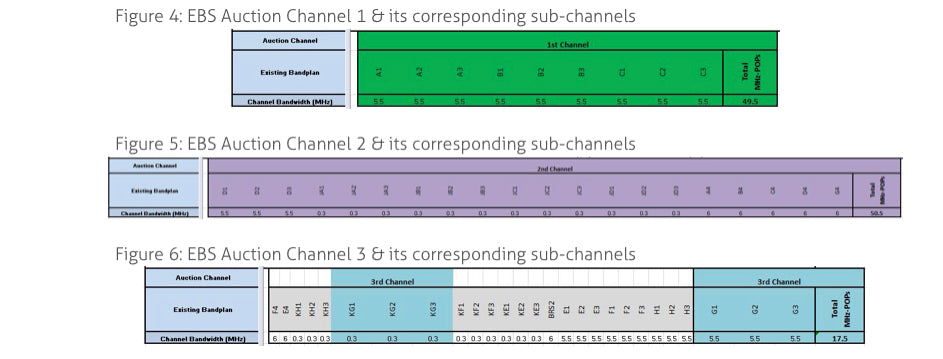
Each of the auction channels is a different size in terms of bandwidth. Below are the sizes of each auction channel, measured in MHz:
The EBS Whitespace Auction Opportunities Tool is an Excel-based product which provides insights into the available 2.5GHz unlicensed spectrum for each of the three EBS auction channels. This tool will allow all interested parties — including wireless carriers, telephone companies, internet service providers, and investors — to determine the amount of available spectrum that can be licensed in a county.
The Auction Opportunities Tool is designed to show the number of people that can be served within the whitespace in each auction channel at a county level.
The composite view of all US counties provides insights into the areas where spectrum is available and a larger picture of the overall size of the EBS Whitespace Auction. The primary tools available within the Auction Opportunities Tool are:
When looking at the geographic whitespace in a county, there is the potential for each sub-channel’s unlicensed areas to look different. In the EBS Auction Opportunities Tool, we have summarized the amount of people that fall into the whitespace areas for each county. The total MHz-POPs available in each auction channel has been calculated accordingly.
MHz-POPs is a measurement of how much spectrum is available across a market area, typically defined by its population. For EBS spectrum, MHz-POPs are calculated by taking the population available in each sub-channel times the MHz bandwidth of that channel. Since cell phone service is a revenue opportunity tied back to individual consumers, MHz-POPs is a measurement that allows auction participants to forecast the total opportunity within an area of whitespace in a county, therefore determining the general value of the spectrum area.


For example, for two counties in West Virginia, the whitespace area matches the county boundary for the entirety of EBS Auction Channel 1 (figures 7 & 8). This is clearly demonstrated using Population Percentage View (figure 9), which shows that 100% of the total county population falls in the whitespace area for each of the sub-channels that make up EBS Auction Channel 1. To make this more apparent, we employ a “heat chart” format where channels with lower available population% are indicated in red, while high available population% are green. Accordingly, Kanawha and Putnam counties are both highlighted in green across Auction Channel 1. The implication of this data is that the available whitespace population in these counties is equal to the county population and the winning bidder will have access to the entire EBS Auction Channel 1 (49.5 MHz) over the entire county population.
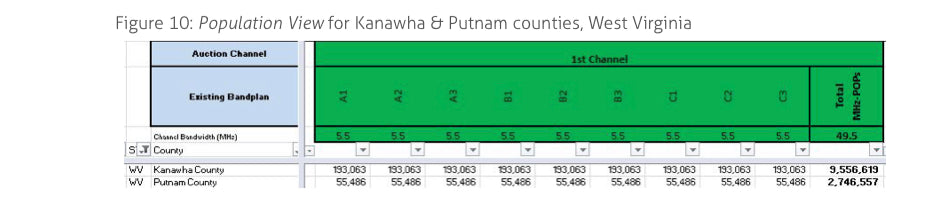
The exact number of people that channel 1 would be able to reach, if licensed, can be evaluated using Population View, which shows the actual whitespace population for each county, along with the total MHz-POPs available for EBS Auction Channel 1 (figure 10). In Kanawha County, the total population is 193,063 x 49.5MHz (channel 1 width), resulting in 9,556,619 MHz-POPs.
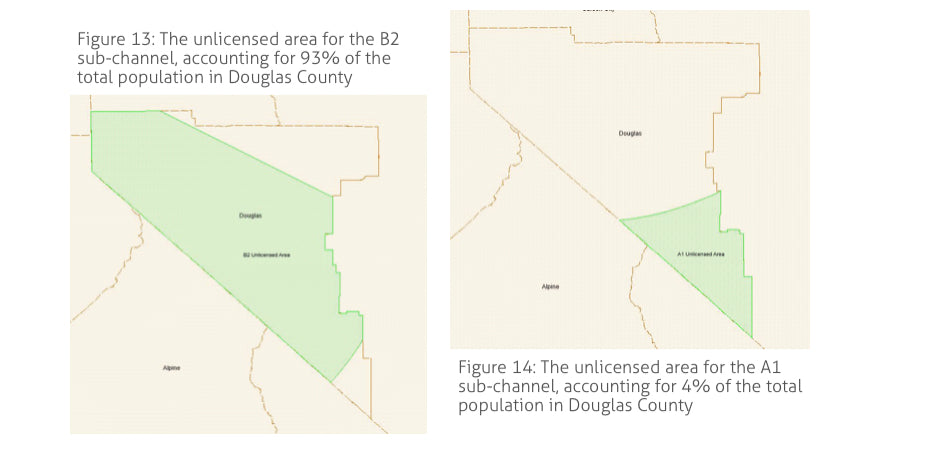
In some counties, the unlicensed area will be different for several of the sub-channels. In Douglas County, Nevada, the amount of available whitespace for Auction Channel 1 ranges from 4% (red) to 93% (green) of the total county population. Accordingly, the winning bidder for Auction Channel 1 in Douglas County could use the 5.5MHz B2 channel to reach 93% of the county population with a wireless signal.

In Population View, the raw population counts in each sub-channel’s whitespace area are shown, along with the total MHz-POPs for the entire auction channel. Looking at the B2 sub-channel in Douglas County, one is able to determine that over 43,000 people could be served with a 5.5MHz wireless signal on this sub-channel.
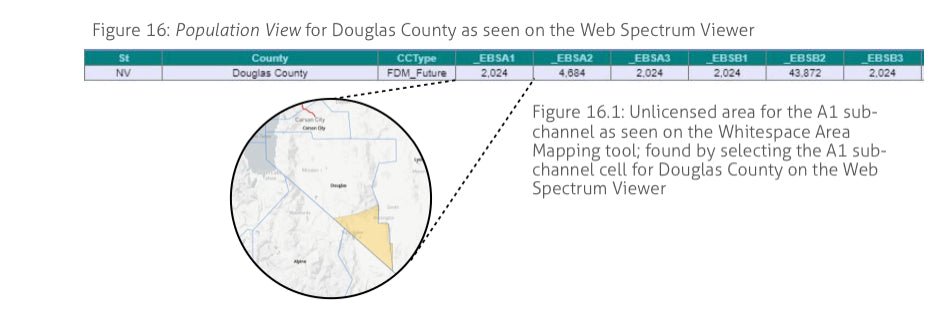
To accurately represent whitespace areas geographically at a county-by-county level, we have added an EBS Auction section to our Web Spectrum Viewer tool. In this section, you will see a similar population view and population percentage view as the Excel tool. In the web view, the user has the ability to select individual sub-channels by clicking the corresponding cells. This will reveal the whitespace area for that specific sub-channel represented visually. Here, a user can gain important insight to more accurately evaluate the available whitespace in that county. Cities, roads, and other landmarks are clearly identified on our Whitespace Area Mapping tool, making it easy to determine whether or not they fall within the available unlicensed areas.

In addition to geographic mapping through our Web Spectrum Viewer, we are also providing MapInfo TAB files and Google Earth KMZ files as part of each one-time subscription. This would allow the user to utilize these mapping layers in conjunction with their internal infrastructure data.
Before the EBS Whitespace Auction goes live, first priority for this spectrum has gone to Native American Tribes to access the whitespace spectrum overlapping with their tribal lands. Each tribe is required to submit an official FCC application to acquire this spectrum, and new Tribal Land licenses are being granted periodically. The information regarding individual Tribal Land licenses will be included in our Whitespace Auction Opportunities Tool. However, as this process is still ongoing, these newly licensed tribal areas are not yet removed from the overall whitespace area on our tool. Once all tribal licenses are finalized by the FCC, our geographic files and our Whitespace Population tools will be updated and made available to all Whitespace Tool users.
We will provide the tribal lands overlay (see below) as new applications are finalized by the FCC, so the effect of the tribal licenses can be predicted as things progress.

The EBS Whitespace Opportunities Tool is available for purchase in two different versions: a national version with all fifty states and US territories, or a specific state-by-state version. In the state-by-state version, you will have the ability to specify as many states as you would like. On our website, simply select the State version of this product, then specify the number of states you’d like to purchase in the quantity field provided. On your way to check out, you will be given the option to “add special instructions.” In the corresponding text box, indicate exactly which states you want included in your one-time subscription.

The EBS Whitespace Opportunities Tool is delivered by download from a cloud service. A link for this download will be provided after your payment is confirmed. Typically you will have access to the data within the same business day of your payment being processed.
All purchases are corporate subscriptions, which allow any employee within the same email domain to utilize the data and request access to the Web Spectrum Viewer.
To schedule a video demonstration, email info@allnetinsights.com or call (425) 522-2142.

Purchases can be made through our website or by emailing us at info@allnetinsights.com.
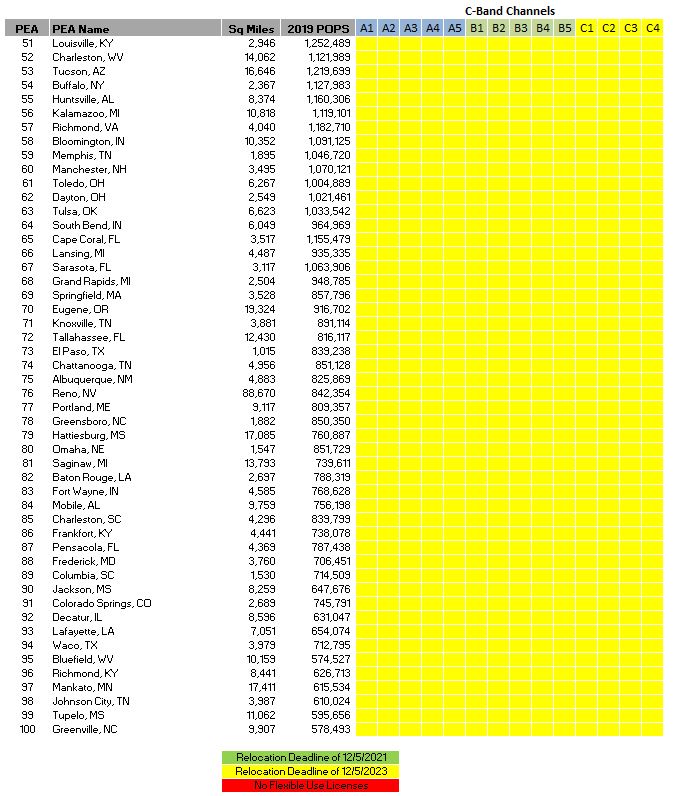
With Auction 107 officially starting a week from tomorrow, we developed a two helpful graphics to indicate when the C-Band channels will be available in each of the Top 100 Partial Economic Area (PEA) markets. The A channels indicated in green will be available by December 5, 2021 with all of the yellow channels available by December 5, 2023. The Honolulu HI PEA will not have C-band spectrum available as the spectrum is reserved to meet the continued satellite video demand.

Today, the FCC ruled that Dish should not have received small company discounts for their bidding partners in the AWS-3 auction, meaning that Dish would need to pay full price for the spectrum licenses won by Northstar and SNR or they would need to return the spectrum to the FCC for a re-auction.
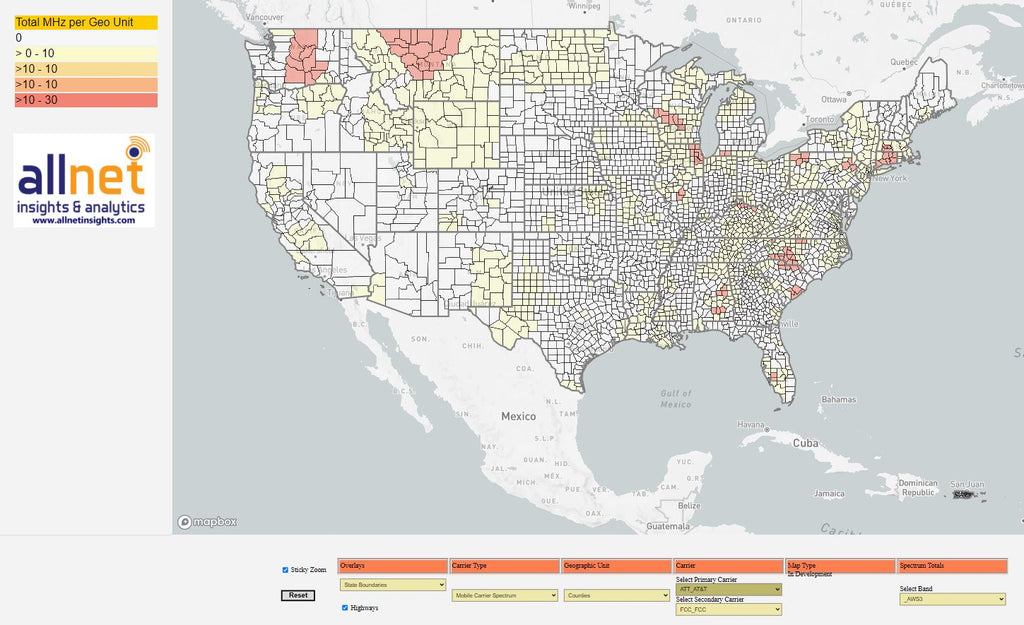
Below is a map that reflects the AWS-3 spectrum that would be available at auction if Dish declines to pay the full auction price.
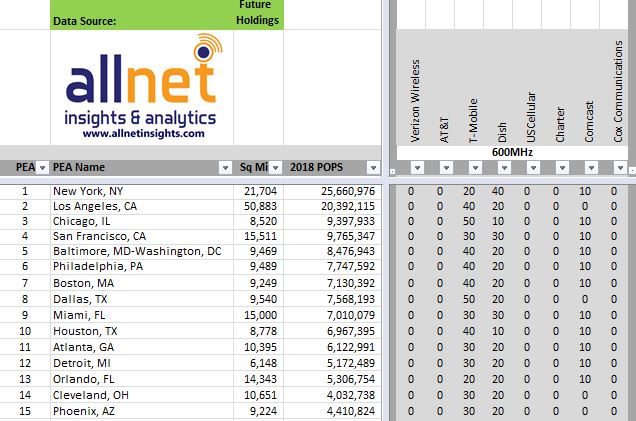
The next questions will focus on who could benefit most from this spectrum. In the image below from our Spectrum Ownership Grid, the AWS-3 ownership for the Top 3 US markets are shown. The columns filled with "FCC" indicate the spectrum that would be re-auctioned, so there would be a 5x5 channel in the New York EA (Economic Area Market) and a 10x10 channel in the Chicago market between the Chicago CMA (G channel) and the Chicago EA (H channel). It is work noting that AT&T already has a strong position in these markets, but Verizon lacks AWS-3 spectrum in each of these markets, although no AWS-3 spectrum is available in the Los Angeles market.

On October 23, 2020 the FCC granted EBS whitespace licenses to 154 Tribal Applicants through the Tribal Priority Window. This is the first stage to the EBS (2.5 GHz) auction. Below is a map representing all 154 tribal areas (in brown) along with the licensing contours (in green) for the EBS A1 channel. Most of the 154 tribal applications claimed the unlicensed (whitespace) area for each of the three EBS auction channels.

It is important to recall that each of the EBS auction channels consists of multiple existing EBS channels that have different existing licensing boundaries. EBS Auction Channel 1 consists of the A1 channel shown in the map along with 8 other EBS channels. In the map below, we show how the Tribal whitespace boundaries overlap with the existing license boundaries in Southern Utah and Northern Arizona. For the areas that are covered by the green licensed areas, the Tribal applicants do not have access to the A1 channel in EBS Auction Channel 1.

To determine the amount of spectrum available to each Tribal area, you must evaluate the available whitespace area with the Tribal boundary for each existing license channel like we did above for the EBS A1 channel.

In the November 2020 updates to our Mobile Carrier and Millimeter Wave - Spectrum Ownership Analysis Tools, we have added Carrier - Spectrum Ownership Charts that provide a breakdown of each carriers spectrum assets by band classification (low band, lower mid band, and upper mid band) and by frequency band. Each of these charts are based upon the total MHz-POPs that a carrier controls in each band classification or frequency band. Within the each Spectrum Ownership Analysis Tool, eight carriers can be selected from the available 2200 licensees and spectrum holders, to compare each carriers spectrum portfolio side by side.
Carrier Spectrum Divisions (by Band Classification):

Carrier Spectrum Divisions (by Frequency Band):

In both tools we continue to also have charts that detail for the same eight selectable carriers, each carrier's proportional ownership for each frequency band.
National Band Ownership:

Last month we presented some initial analysis of T-Mobile's agreement to lease 200 - 600MHz licenses from Dish. Now that we have released our October 2020 Mobile Carrier - Spectrum Ownership Analysis Tool reflecting all of the September 2020 transactions, we can compare the 600MHz results between the October 2020 and September 2020 versions.
MHz-POPs:
Our October 2020 - Spectrum Ownership Analysis Tool reports that T-Mobile controls 12,593,033,060 MHzPOPs in the 600MHz band, an increase of 982,154,940 MHzPOPs over the number of MHzPOPs that T-Mobile held in September.
Spectrum Grid:
In the Spectrum Grid sequence below, You can see the effect of two transactions that were both filed in September. First, Charter's lease of Comcast's A block spectrum is seen in the top image (October 2020) and T-Mobile's lease of Dish's D block spectrum can be seen to increase their New York channel size to 15MHz. The lower image represents each carrier's spectrum held for September 2020.
October 2020:

September 2020:

PEA Market Analysis:
In comparing the PEA Market Analysis outputs below, you can see the increase in T-Mobile's 600MHz spectrum in New York, Miami, Detroit, Orlando, and Cleveland.
October 2020:

September 2020:
In August, we had blog post that discussed the counties that are on the EBS band plan and the way that the EBS license areas were determined. In this post we are going to examine how to use our EBS Whitespace Auction Opportunities Tool.
The EBS Whitespace Auction Opportunities Tool provides carriers, telephone companies, internet service providers (ISP), cable companies, investors, and financial analysts with the tools to evaluate the opportunities in this auction.
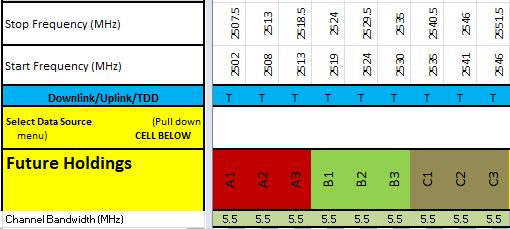
As we discussed before, this auction will provide the winner's access to 3 wide band channels in the EBS (2.5GHz) band. One channels is 49.5 MHz, one channel is 50.5 MHz, and one channel is a combined 17.5 MHz. In the images below, we indicate how each of the existing EBS channels (A1,A2,..) are component channels in the larger wide band EBS Auction channels.
EBS Auction Channel 1:

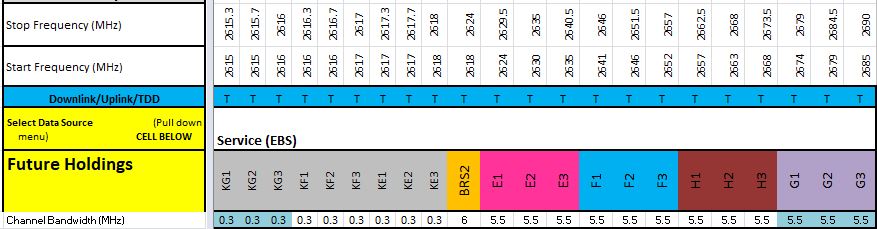
EBS Auction Channel 2:
EBS Auction Channel 3:

The population that a bidder can serve is determined by the unlicensed population for each of the component channels within each EBS auction channel.
Below is an example of two counties in West Virginia where 100% of the county population is available for each component channel in the EBS Auction Channel 1. In our EBS Whitespace Auction Opportunities Tool this is seen in the Spectrum Grid (% POPs) worksheet. The percentage of the available unlicensed population is divided by the full county population.
Population Percentage Worksheet:

The second worksheet in the EBS Whitespace Auction Opportunities Tool provides the discrete available unlicensed population for each component channel as well as total MHz-POPs for the entire EBS Auction Channel.
Population Worksheet:

Our next example is a Nevada county that has varying available whitespace population for each component channel. In the POPs view immediately below, the available whitespace population for EBS Auction Channel 1 varies from 2,024 for the A1 component channel to 43,872 for the B2 channel.
Population Worksheet:
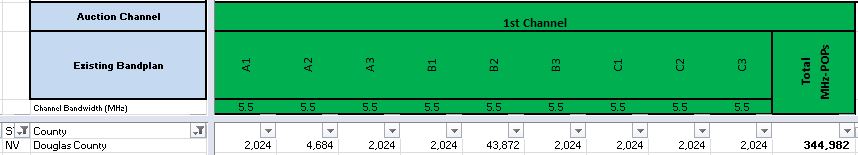
In the % POPS view, the population comparison to the total county population is highlighted with Red to Green cell colors. For the A1 component channel, the 2,024 available whitespace POPs represents 4% of the Douglas county population while for the B2 component channel, the 43,872 available whitespace POPs represents 93% of the Douglas county population.
Population Percentage Worksheet:

Available Whitespace Area:
In addition to Population Analysis to each component channel, purchasers of the EBS Whitespace Auction Opportunity Tool also receive access to our EBS Whitespace Mapping module in our Web Spectrum Viewer. Selecting either the A1 component channel cell for POPS or for % POPs, the whitespace license area map for that component channel is displayed.
A1 Component Channel Whitespace Area:

For the B2 component channel the whitespace license area fills a majority of Douglas county reflecting the 92% population availability.
B2 Component Channel Whitespace Area:

The EBS Whitespace Auction Opportunities Tools is available either as a nationwide purchase (all 50 states and US territories) or a state by state purchase. The purchase will enable carriers and investors to evaluate their opportunity to add 2.5GHz spectrum in the targeted markets and it will allow investors to quantity the national or state opportunities for these new channels as well as provide an evaluation of the strength or weakness of the existing 2.5GHz licensee in each market.


The 10 highest bidders in the CBRS auction are shown in the table below. How did each of these bidders' investments translate into the percent of the their ownership within the CBRS band?
![]()
In our Frequency Band Ownership chart from our updated Mobile Carrier - Spectrum Ownership Analysis Tool, you can see the relative ownership percentages based upon each bidders total MHz-POPs in the CBRS band. Clearly the top 5 bidders turned their investment into a significant share of the CBRS band.

The primary challenge in evaluating the EBS Whitespace auction opportunities, lies with the available licensing information provided by FCC. For each of the EBS licenses, the FCC provides a map for a 35 mile radius circle from the license centerpoint. Below is the FCC map for WHR463, an EBS A1 channel license in Los Angeles county. Not indicated in this map, is the overlap that this license has with two other A1 channel licenses in Los Angeles county.
WHR463:

In two images below, it is clear that a significant portion WHR463's 35 mile radius license area is shared with WHG227 and WND634.
WHG227:

WND634:

The FCC resolves these overlap issues through the creation of Geographic Service Areas (GSA) for each license_channel combination. The starting point is to look at all of the 35 mile overlaps on an individual channel basis, e.g. A1, A2, ...
Here is an example case with 5 licenses in a 4 county area.

The Geographic Service Areas are initially created by bisecting each of the overlapping areas (splitting the football) so each license has its own exclusive area.

The GSA's were formed based upon active licenses on a specific date. Licenses that were issued after this date (PSA6) do not claim any part of the overlap area with existing GSAs.

These GSA's are sometimes referred to as "Cookie Bite" GSAs.

After the GSA's were formed, any cancelled or terminated licenses lost their area, but none of that area is added to the GSAs that previously overlapped the cancelled/terminated licenses.

The map below represents the licensed spectrum in this 4 county area, prior to the EBS Whitespace Auction for a specific channel.

The final representation of the unlicensed (whitespace) area in each county that will be available in the auction is the area from the GSA boundary for each license to the county boundary.

Going back to Los Angeles County A1 channel example, you can see the WHG227, WHR463, and WND634 licenses in the center of the map reflecting each of their A1 Channel GSAs.

Our final map indicates the whitespace area for the A1 channel in Los Angeles county. Call signs WHG227 and WND634 were both cancelled after the GSA boundaries were computed, thus their license area is now part of the A1 channel EBS Whitespace, indicated in the orange cross hatch.